Step 1: Segment before you set anything
A single threshold applied to every customer is the most common calibration error. A retail account holder, a payment processor's settlement account and an iGaming operator's wallet have different normal behavior, so a number that is anomalous for one is routine for another.
The HKMA material describes customer segmentation as dividing customers into groups with shared characteristics or behaviors so that appropriate thresholds can be set for more targeted monitoring, and it warns that inappropriate segmentation can undermine the whole system. Regulatory guidance from 2024 to 2025 likewise points institutions to risk-based customer and product segmentation as the foundation, with parameters grouped into scenarios aimed at specific typologies such as smurfing, pass-through payments and circular flows.
Practical segmentation dimensions:
Customer type: individual, sole trader, corporate, regulated financial institution.
Product and channel: card, account-to-account transfer, cash, crypto on-ramp, wallet top-up.
Expected activity: declared turnover, typical ticket size, counterparties and geographies from onboarding and KYB.
Risk rating: higher-risk customers warrant tighter thresholds and shorter review windows.
Segments should be homogeneous enough that a threshold is meaningful for every member, and few enough that each can be tested with sufficient data. A segment with a handful of customers cannot support statistical tuning.
Step 2: Build a quantitative baseline
Before changing anything, measure the current state per rule and segment: alert volume, the share closed as false positive, the share escalated, the number of STRs or SARs filed, and the average handling time.
A common way to set initial thresholds is statistical. Institutions look at distributions of historical activity and place a cutoff at a number of standard deviations from the segment mean, or at a percentile rank. The HKMA paper lists both approaches. Percentiles tend to be more robust than standard deviations when transaction amounts are heavily skewed, which they almost always are.
Data quality comes first. If transaction fields are missing, mislabeled or inconsistently mapped, the baseline is wrong and every downstream decision inherits the error. Examiners look for evidence of sound data governance, and a threshold tuned on faulty data cannot be defended.
Step 3: Test in both directions
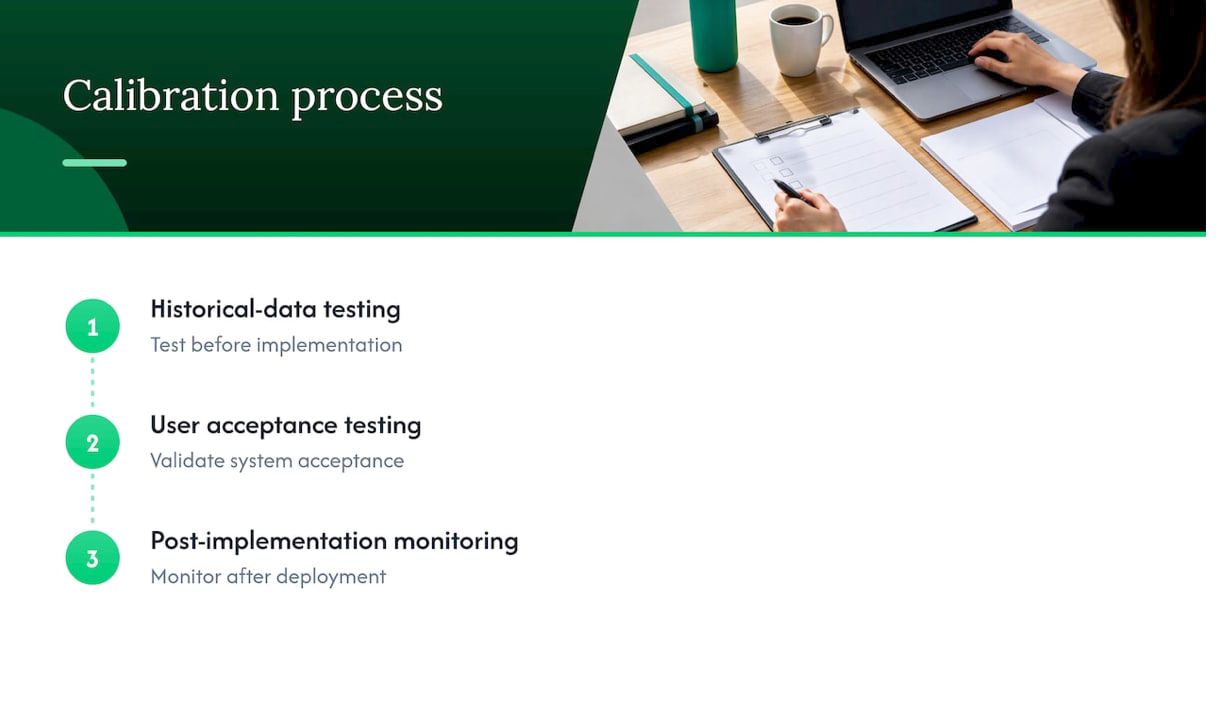
The two standard techniques are Above-the-Line and Below-the-Line testing.
Test What you do Question it answers
Above-the-Line (ATL) Raise the threshold on historical data and measure the effect How many alerts disappear, and were any of them productive?
Below-the-Line (BTL) Lower the threshold and review the additional alerts Is suspicious activity currently falling just under the cutoff?
The ACAMS white paper on auditing transaction monitoring systems notes that below-the-line sampling is often performed at a percentage band beneath the investigation threshold, such as 10 percent, and that it should be run per transaction type.
The HKMA material cites a documented case in which optimized threshold techniques reduced alert volume by 5.4% while keeping the same STR capture rate. The figure is modest, and that is instructive: credible calibration gains are usually incremental and verified, not dramatic.
The trap of subjective testing
The Deloitte paper on optimizing rule-based transaction monitoring systems notes that rule-based systems cannot adapt thresholds automatically and so still need regular manual review. It also points to a recurring failure: teams use ATL results selectively to justify lower volumes, without weighing what they might lose. Raising thresholds only to minimize false positives inevitably raises the risk of false negatives, and regulators may treat the resulting gaps as systemic ineffectiveness.
A more disciplined approach assigns explicit costs to each error type through a loss matrix, or relies on rigorous statistical modeling, so the final threshold reflects a stated trade-off. If a change cannot be explained as a trade-off between missed risk and workload, it should not be approved.
Step 4: Optimize the alert-to-STR ratio, not the alert count
Cutting alerts is a means. The measure that matters is how many alerts convert into reportable cases. Deloitte's analysis frames the goal as improving the alert-to-STR ratio and cautions that institutions focused solely on volume often create gaps in coverage that examiners cite as evidence of an inadequate program.
Useful metrics per rule and segment:
Alerts per 1,000 customers or per 10,000 transactions.
Percentage of alerts escalated to a case, and from case to filing.
Number of filings that originated from the rule, and whether other rules would have caught the same activity.
Age of the oldest open alerts, which signals whether the volume is manageable.
The last point on redundancy deserves attention. Research on multi-dimensional threshold optimization addresses the common problem of slack, where several scenarios flag the same activity. Removing overlap can cut volume without changing detection sensitivity at all, which is a safer first move than raising a number.
Step 5: Consider a machine learning layer carefully
Many institutions now add machine learning as a bolt-on to rule-based monitoring. The model scores each alert on the likelihood of being a true positive, using historical outcomes. Low-scoring alerts are hibernated or deprioritized, and high-scoring ones are escalated. This separates alert volume management from raw rule sensitivity: the rule still fires, but the queue is ordered by risk.
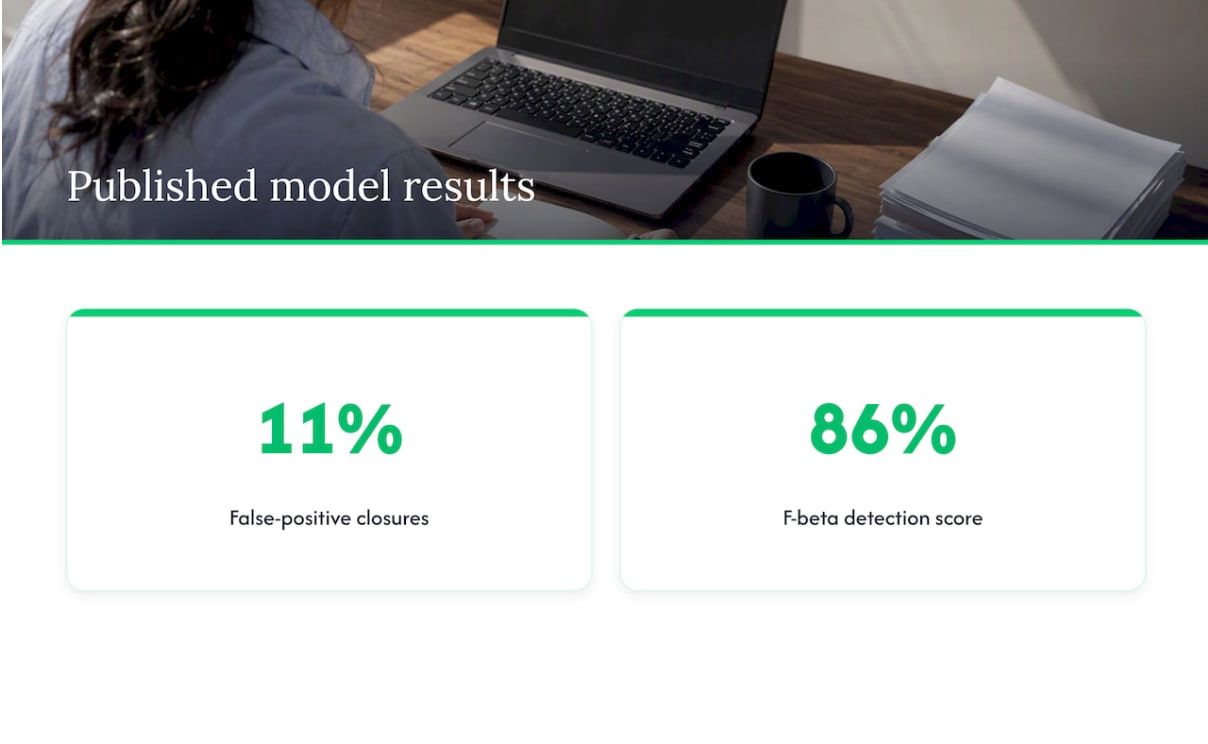
Published results are encouraging but specific. A study in the Journal of Money Laundering Control on a scoring model using machine learning reports a framework that reduced false positive closures to 11% while holding an 86% F-beta detection score. A separate paper on automatic suppression of false positive alerts describes grouping alerts by customer, predicting their importance and suppressing those under a cutoff. Earlier research on detecting money laundering transactions with machine learning found that excluding investigated but non-reported alerts from training data can produce a suboptimal model, which is a reminder that outcome labeling matters.
Two cautions apply. The suppression cutoff is itself a threshold and must be calibrated, tested and documented like any other. And the model must be explainable enough that an examiner can see why an alert was hibernated.